
I Tested the Famous Market Cycles on 98 Years of Data. Here's What They Got Right in 2026.
Every December, paid forecasts promise to map the year ahead: the decline will start in February, the low comes on a precise date, then the big rally. I bought one of these reports for 2026. Then I did what most readers never do - I checked it.
What the forecast said. A decline from mid-February, the year's low around 16 June, then a strong rally into the end of the year. The overall call: 2026 would be a good year for stocks.
What actually happened. The S&P 500 slipped from late January and fell about 9% to its low on 30 March. From April it climbed, and by early October it was up about 14% for the year.
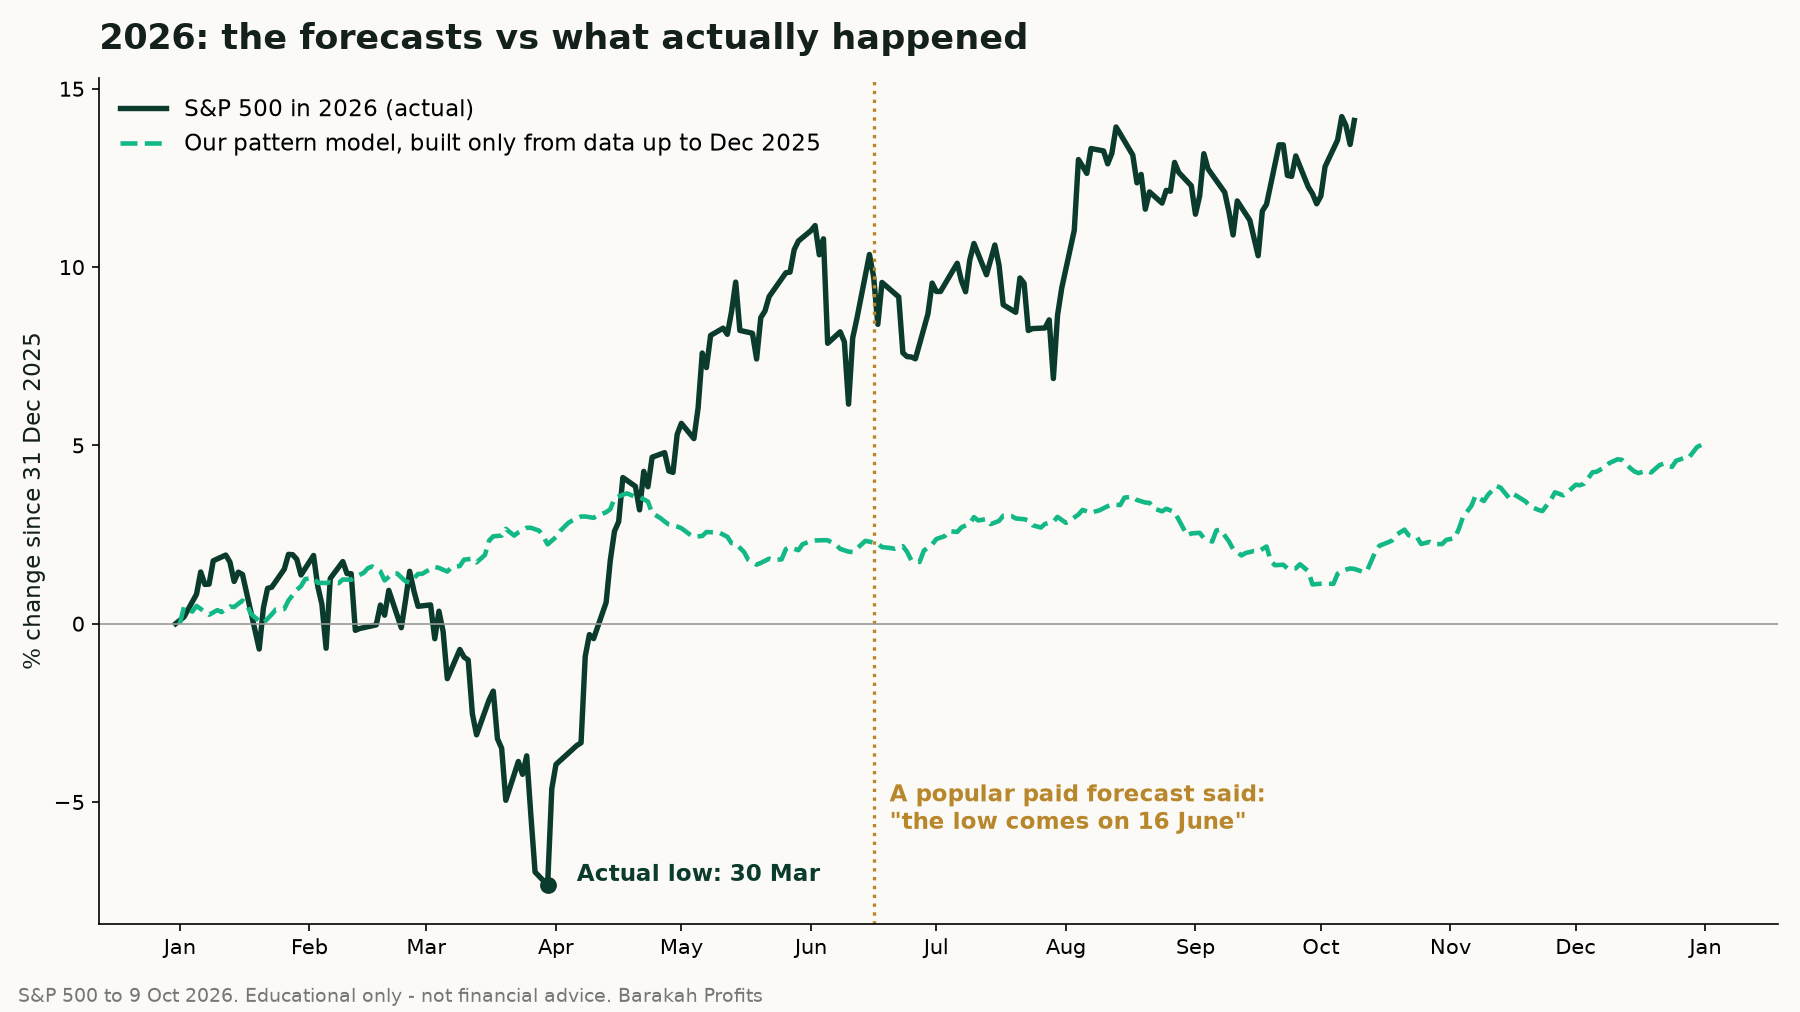
So the direction was right, and the timing was two and a half months late. Anyone who waited for a June low to put money to work missed most of the year's gain.
Our own model did no better on timing. I rebuilt the classic patterns from free data going back to 1928: the average year, years ending in the same digit, and the US presidential cycle. Built only from data up to December 2025, it also expected a positive year - and it also missed the March drop entirely.
The honest test
One year proves nothing, so I tested every pattern the fair way: for each year from 1960 to 2025, build it only from the years before, then check its call.
| Method | Called the year's direction | First half | Second half |
|---|---|---|---|
| Simply assume the market rises | 71% | 70% | 71% |
| The average-year pattern | 71% | 70% | 71% |
| Years ending in the same digit | 62% | 71% | 61% |
| Presidential cycle | 70% | 59% | 58% |
| All three combined | 71% | 76% | 68% |
Read that first row carefully. Over 66 years, "the market goes up" was right 71% of the time. The famous cycles mostly tie with it. Only the combined first-half call did a little better.
What this means for a halal value investor
- Markets rise in roughly seven years out of ten. Time in the market beats precise timing - and the halal funds most of us use track the same market.
- Precise dates sell reports. They are the weakest part of any forecast.
- Big drops are when quality businesses get cheaper. The March fall is exactly when a patient investor's watchlist of halal, fairly priced businesses becomes useful - not a date someone circled a year ago.
We will publish our own outlook every December and update it every June, with the full scorecard of what we got right and wrong. No paywall, no promised dates - just what the data shows and how reliable it has been.
Educational only - not financial advice. Past patterns do not guarantee future results. Data: S&P 500 (Yahoo Finance), 1928-2026.